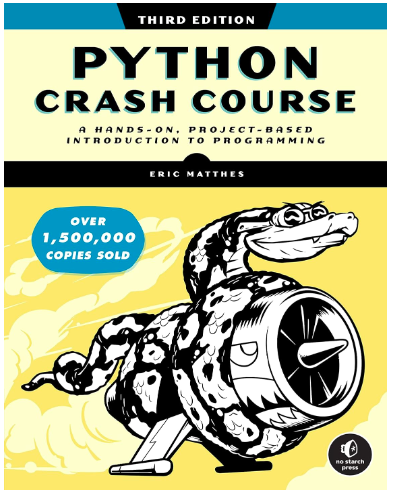
This is the textbook we used. This was one of the most fun classes I've ever taken. It was a magic combination of a great textbook, a great course structure, fun classmates, and a great instructor!
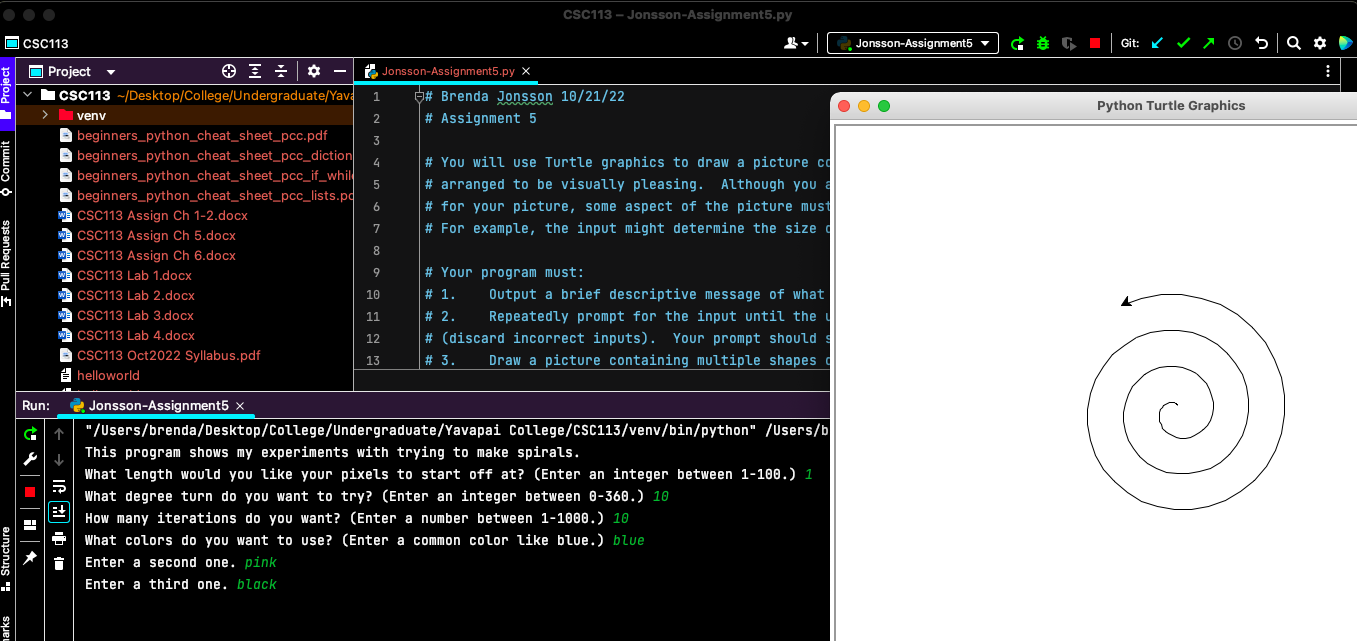
This is one of the first projects we did. It was with a mathematical image-generating program called "Turtle." Don't be put off by the "cheat sheets" in the file manager--those were teacher-given PDF files of common Python functions!
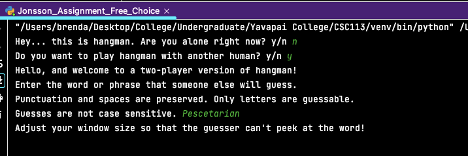
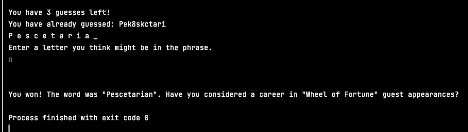
Here is one of the word games we made: Hangman. I'm embarrassed to say that I spelled "Pescatarian" wrong! I know better now. But it's simple and there's no guarantee that the player will spell the word correctly.
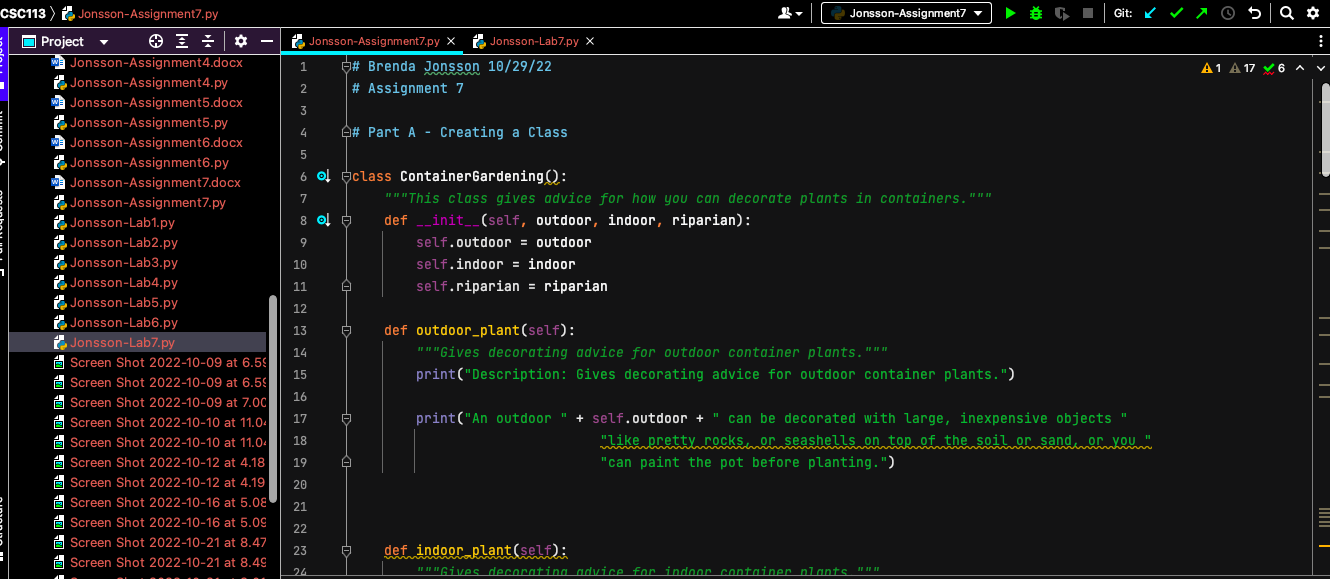
We tackled classes toward the end of the class.
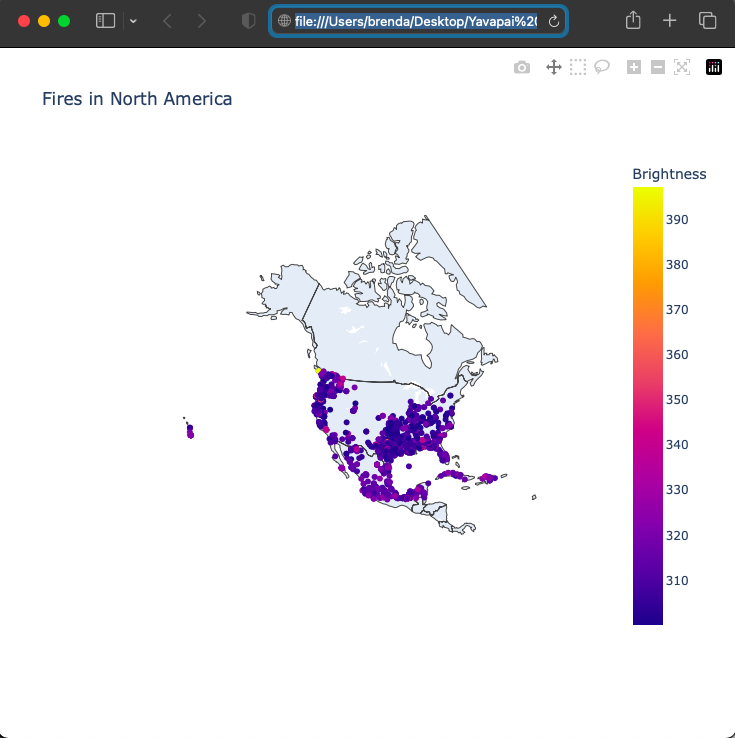
Some of our later assignments were about manipulating data sets. This one mapped fires in North America. It was very challenging to get the whole of North America to show up! I really wanted it to though, because the data came from all of North America.
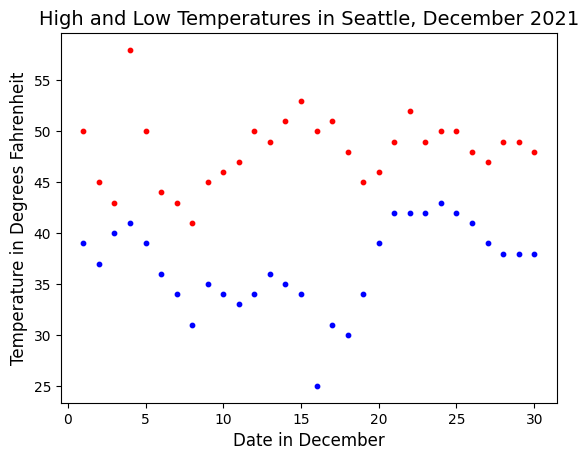
I fed in a data set of high and low temperatures in Seattle in December 2021 to create this chart.
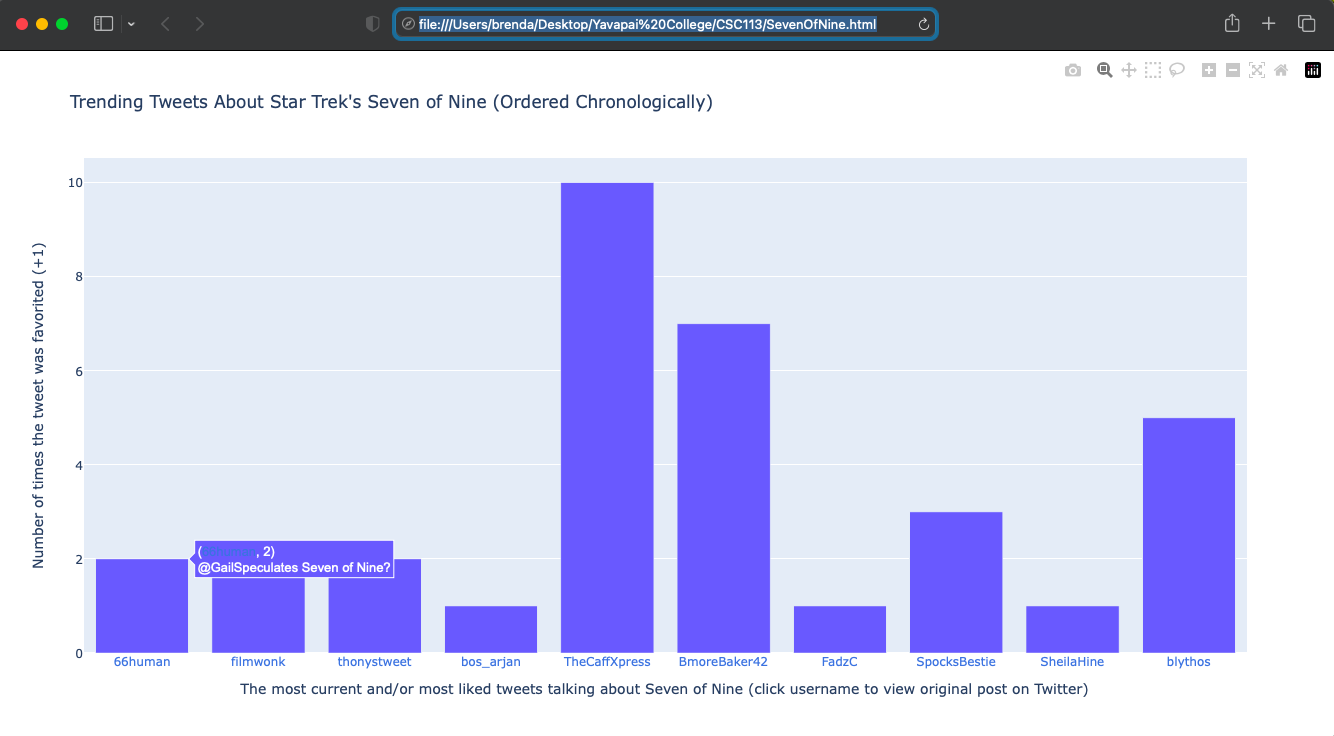
One of my favorite assignments was to use an API to create something. I made an interactive bar chart of the most popular Tweets mentioning Seven of Nine from Star Trek: Voyager.
For the final project, I made a quiz asking the user what craft kit they would like to work on. Then it uses Etsy's API to link the user to the most popular kit for that craft. It was a good thing I started quite a bit ahead of schedule, because it took over a week to get my API key!